wildpixel/iStock via Getty Images Investment Thesis The Pacer US Cash Cows 100 ETF (BATS:COWZ) reconstituted after business close on Friday, substituting 29 stocks that resulted in 9% more exposure to the Technology sector and 5% less Energy. While I appreciate the better balance, COWZ is no longer the same high-quality large-cap value ETF it once was, as now 30% of the portfolio is allocated to stocks with market caps below $10 billion. Like in March, this article discusses the fundamental implications of these changes and compares COWZ against some of the newer free cash flow funds on the market. I hope you enjoy the read. COWZ Overview Strategy Discussion COWZ tracks the Pacer US Cash Cows 100 Index, selecting 100 stocks from the Russell 1000 Index based on their free cash flow yields. This single metric combines quality (free cash flow) and value (enterprise value), resulting in a substantially different portfolio than Pacer’s preferred benchmark, the Russell 1000 Value Index. Pacer ETFs The above is a screengrab from COWZ’s Fact Sheet as of March 31, 2024. Although outdated, it describes what it does well, specifically selecting high-quality large-cap companies trading at a discount. However, this quarter’s reconstitution reminded me how “large-cap” is a loose term, and the Russell 1000 Index includes 378 stocks with market caps below $10 billion, the threshold many use to describe mid- or even small-caps. Since COWZ tends to select deep-value stocks, it has always been on the smaller side. However, my first takeaway for readers is that COWZ’s weighted average market cap declined from $48.03 billion to $26.53 billion this quarter, and the percentage of companies with market caps below $10 billion jumped from 17% to 30%. One year ago, these figures were $62.18 billion and 17%, respectively. This trend makes sense based on recent returns of value stocks. As shown below, small- and mid-cap value stocks have significantly trailed large-cap value stocks over the last three years. As a result, they’re more likely to have strong value characteristics and be selected by rules-based funds, provided they are in the selection universe. Portfolio Visualizer Performance Analysis COWZ has struggled since my March review, where I noted its deep-value, low-growth approach could either pay off handsomely or perform terribly. As shown below, COWZ delivered a -1.78% total return since March 16, 2024, slightly worse than other free-cash-flow funds like VFLO, FLOW, and COWS. Seeking Alpha Since COWS launched on September 12, 2023, COWZ has lagged all these peers by 4-9%. Seeking Alpha However, COWZ has outperformed many popular large-cap value dividend-oriented ETFs since its inception, including the Schwab U.S. Dividend Equity ETF (SCHD) and the ProShares S&P 500 Dividend Aristocrats ETF (NOBL). Portfolio Visualizer Still, its risk-adjusted returns (Sharpe and Sortino Ratio) aren’t as impressive, indicating risk management is something investors should consider. COWZ’s success largely came from high allocations to Energy stocks as inflation ran high. As I initially predicted, it was slow to unwind its holdings in this sector because its screens are all backward-looking. This weakness was what Victory Capital attempted to fix with VFLO, and although it’s still in its early days, it’s out to a nice lead and has already attracted $500 million in assets. COWZ Analysis Q2 2024 Reconstitution Summary: 29 Additions Effective June 24, 2024, COWZ added 29 new stocks, as follows: Hewlett Packard Enterprise (HPE): 2.08% Archer-Daniels-Midland (ADM): 1.99% Halliburton (HAL): 1.96% Gen Digital (GEN): 1.72% WESCO International (WCC): 1.12% RPM International (RPM): 0.92% ADT Inc. (ADT): 0.86% Mattel (MAT): 0.84% Ralph Lauren (RL): 0.78% Juniper Networks (JNPR): 0.74% Incyte (INCY): 0.73% Qorvo (QRVO): 0.69% Arrow Electronics (ARW): 0.66% MasTec (MTZ): 0.65% Kohl’s (KSS): 0.65% F5, Inc. (FFIV): 0.61% PVH Corp. (PVH): 0.60% Twilio, Inc. (TWLO): 0.54% Middleby (MIDD): 0.52% EPAM Systems (EPAM): 0.52% Lear Corp. (LEA): 0.50% Sonoco Products (SON): 0.47% Ciena Corp. (CIEN): 0.41% Cirrus Logic (CRUS): 0.35% ZoomInfo Technologies (ZI): 0.35% Pegasystems (PEGA): 0.28% UiPath (PATH): 0.28% Envista Holdings (NVST): 0.21% Tripadvisor (TRIP): 0.14% On average, these stocks have a $10.18 billion market cap, 14.28% free cash flow margins, and are down 2.48% YTD. Next, let’s see the deletions. Q2 2024 Reconstitution Summary: 30 Deletions On April 1, 2024, 3M (MMM) completed the spin-off of its healthcare business, and as a result, Solventum (SOLV) was created and added to COWZ, bringing its total number of holdings to 101. As a result, the Index deleted 30 stocks to get back to its target 100, with prior weights as follows: Vistra Corp. (VST): 2.97% Exxon Mobil (XOM): 2.08% Chevron (CVX): 2.00% Cencora (COR): 1.96% Occidental Petroleum (OXY): 1.95% Cisco Systems (CSCO): 1.88% Cummins Inc. (CMI): 1.87% Kenvue (KVUE): 1.75% CVS Health (CVS): 1.65% DaVita (DVA): 1.13% Coterra Energy (CTRA): 1.10% Best Buy (BBY): 1.05% NVR, Inc. (NVR): 0.99% Carlisle Companies (CSL): 0.99% Westlake Corporation (WLK): 0.98% DICK’S Sporting Goods (DKS): 0.94% Omnicom Group (OMC): 0.92% Ovintiv Inc. (OVV): 0.88% Skechers (SKX): 0.73% Reliance, Inc. (RS): 0.71% Expeditors International of Washington (EXPD): 0.71% Berry Global Group (BERY): 0.68% Mosaic (MOS): 0.59% Nexstar Media Group (NXST): 0.54% C.H. Robinson Worldwide (CHRW): 0.50% Fortune Brands Innovations (FBIN): 0.45% Polaris (PII): 0.31% Gates Industrial (GTES): 0.31% Solventum (SOLV): 0.29% YETI Holdings (YETI): 0.14% On average, these stocks have a $48.79 billion market cap, 8.13% free cash flow margins, and are up 8.80% YTD. These changes reflect what you can expect with each quarterly reconstitution. First, the quality component is satisfied by adding stocks with high free cash flow margins and removing those with low margins. Second, the value component is satisfied by adding poor-performing stocks and removing top-performing ones. However, the wildcard is the impact of selecting smaller stocks. Size and quality are positively correlated, so because COWZ’s weighted average market cap declined substantially, we should see evidence of a lower-quality portfolio. New Sector Exposures Before I evaluate COWZ’s fundamentals, I want to highlight its sector exposures, both post- and pre-reconstitution. The table below highlights how COWZ has the least exposure to Energy stocks relative to its peers. The offset is a 19% allocation to Technology stocks, the highest since I began coverage. The Sunday Investor COWZ Fundamental Analysis The following table highlights selected fundamental metrics for COWZ’s top 25 sub-industries, which total 80.02% of the portfolio. I’ve also included summary metrics for COWZ’s portfolio pre-reconstitution and metrics for VFLO, FLOW, and COWS at the bottom. The Sunday Investor Here are four observations to consider: 1. Smaller companies typically mean greater volatility, evidenced by COWZ’s five-year beta increasing from 1.20 to 1.25. Oil & Gas Exploration & Production is still the top sub-industry but gone at Integrated Oil & Gas stocks (XOM, CVX), which are historically less volatile than their sector peers. For more color, consider the three-year performance summary for COWZ’s additions vs. deletions (link here), showing COWZ’s additions to be more volatile (standard deviation) with a larger 23.02% maximum drawdown. Portfolio Visualizer 2. COWZ’s free cash flow margins increased from 12.98% to 14.79%, primarily because of higher allocations to asset-light Technology stocks, which generally have higher margins. Based on this, it might be helpful to calculate sector-adjusted profit scores using Seeking Alpha Factor Grades. As shown below, COWZ’s profit score decreased from 8.95/10 to 8.78/10, placing it well below VFLO’s 9.31/10 score. The Sunday Investor 3. COWZ’s forward P/E did not improve, mainly because its methodology does not consider forward-looking metrics. However, trailing valuation metrics like price-cash flow and price-sales improved, leading to an increased sector-adjusted value score (5.67/10 vs. 5.22/10). This value score now makes COWZ the clear leader compared to its peers. The Sunday Investor 4. COWZ’s estimated sales and earnings per share growth rates slightly improved, but like most deep-value funds, they remain virtually flat. Excluding Energy and Materials, two sectors highly influenced by changes in commodity prices, COWZ’s growth rates are 1.07% and 5.23%, so it’s a little better but still not as good as VFLO. Consider these additional growth metrics below, which show COWZ’s 3.69/10 sector-adjusted growth score well below VFLO. The Sunday Investor We can also calculate how much growth has declined recently with these metrics. For example, COWZ’s current holdings grew sales by an annualized 12.85% over the last three years, or 43.72% in total. Sales also declined by 3.80% over the previous year, and with these numbers, we can derive what the annualized sales growth rate was in the first two years with this formula: [(1.1285^3) / 0.9620]^(1/2)-1 = 22.22% In other words, COWZ’s sales growth rate has declined from 17.67% to -3.80%, a 21.47% difference, and with analysts not expecting much for the year ahead, the fact that these stocks are trading at such low valuations is no mystery. For reference, the average value ETF saw its sales growth rates go from 14.86% to 0.15%, a difference of 14.71%. Therefore, sales growth has declined nearly across the board, but it’s more pronounced with COWZ and other free cash flow funds. That’s why they trade at such steep discounts. Investment Recommendation COWZ’s Q2 2024 reconstitution resulted in 29 substitutions, which led to 9% more exposure to Technology stocks, 5% less to Energy, and a significant size reduction that makes it seem more like a mid-cap value fund. I also found quality slightly decreased on a sector-adjusted basis, growth remained flat, and valuation improved, albeit VFLO still looks better on most metrics. Therefore, COWZ shareholders should proceed cautiously and understand its composition is much different than before. It’s priced cheap for a good reason, and since it’s a bit too contrarian for my liking, I have only assigned it a neutral “hold” rating. I hope you enjoyed the analysis, and as always, I look forward to answering any questions you might have in the comments below.
sekar nallalu COWS,COWZ,Cryptocurrency,FLOW,Hoya Capital,The Sunday Investor,VFLO COWZ June Reconstitution: 29 Substitutions Reshape $26 Billion Cash Cows ETF (BATS:COWZ)
Related Posts

Lido DAO Leads Top Crypto Gainers, Some Experts Bullish on 9…
Ethereum staking protocol, Lido DAO, has booked the strongest gains amid a crypto market recovery. On the presale front, the[...]
US Spot Bitcoin ETFs Break Outflow Trend With $30M in Inflows – Finance Bitcoin News
On Tuesday, U.S. spot bitcoin exchange-traded funds (ETFs) reversed their continuous outflow trend, attracting $31.01 million in net inflows. Leading[...]
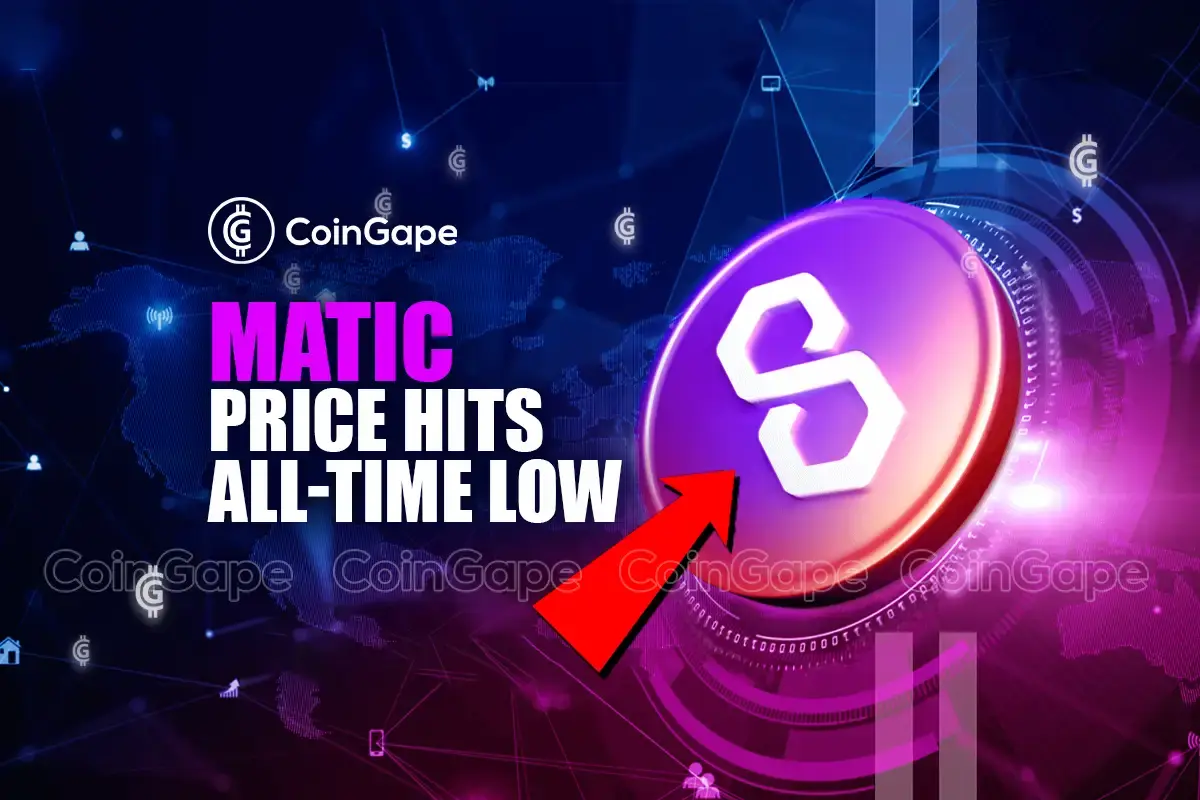
MATIC Price Crash: Reaching A Two Year Low | CoinGape
The last two days have not been easy on the investors, as the crypto market crash has wiped $260 Billion[...]