
Bonk (BONK) has been making waves with a 26.42% surge in the past week, capturing the attention of traders and analysts alike. As key technical indicators flash bullish signals, could BONK be on the verge of an explosive breakout? With the price nearing critical resistance levels and a bullish harmonic pattern emerging, the stage is set for a potential major move.
Technical Indicators
Resistance and Support Levels
- Current resistance: $0.00002
- Next resistance: $0.000025
- Support level: $0.00002 – $0.000021

Moving Average Convergence Divergence (MACD)
The MACD indicator has turned bullish. This occurs when the MACD line crosses above the signal line, indicating a potential upward momentum in the price.

Relative Strength Index (RSI)
The RSI has broken through the downward trendline and is currently at 44, indicating a shift toward bullish momentum. Historically, this level has acted as resistance, and breaking above it suggests further gains.

Harmonic Pattern: Deep Crab
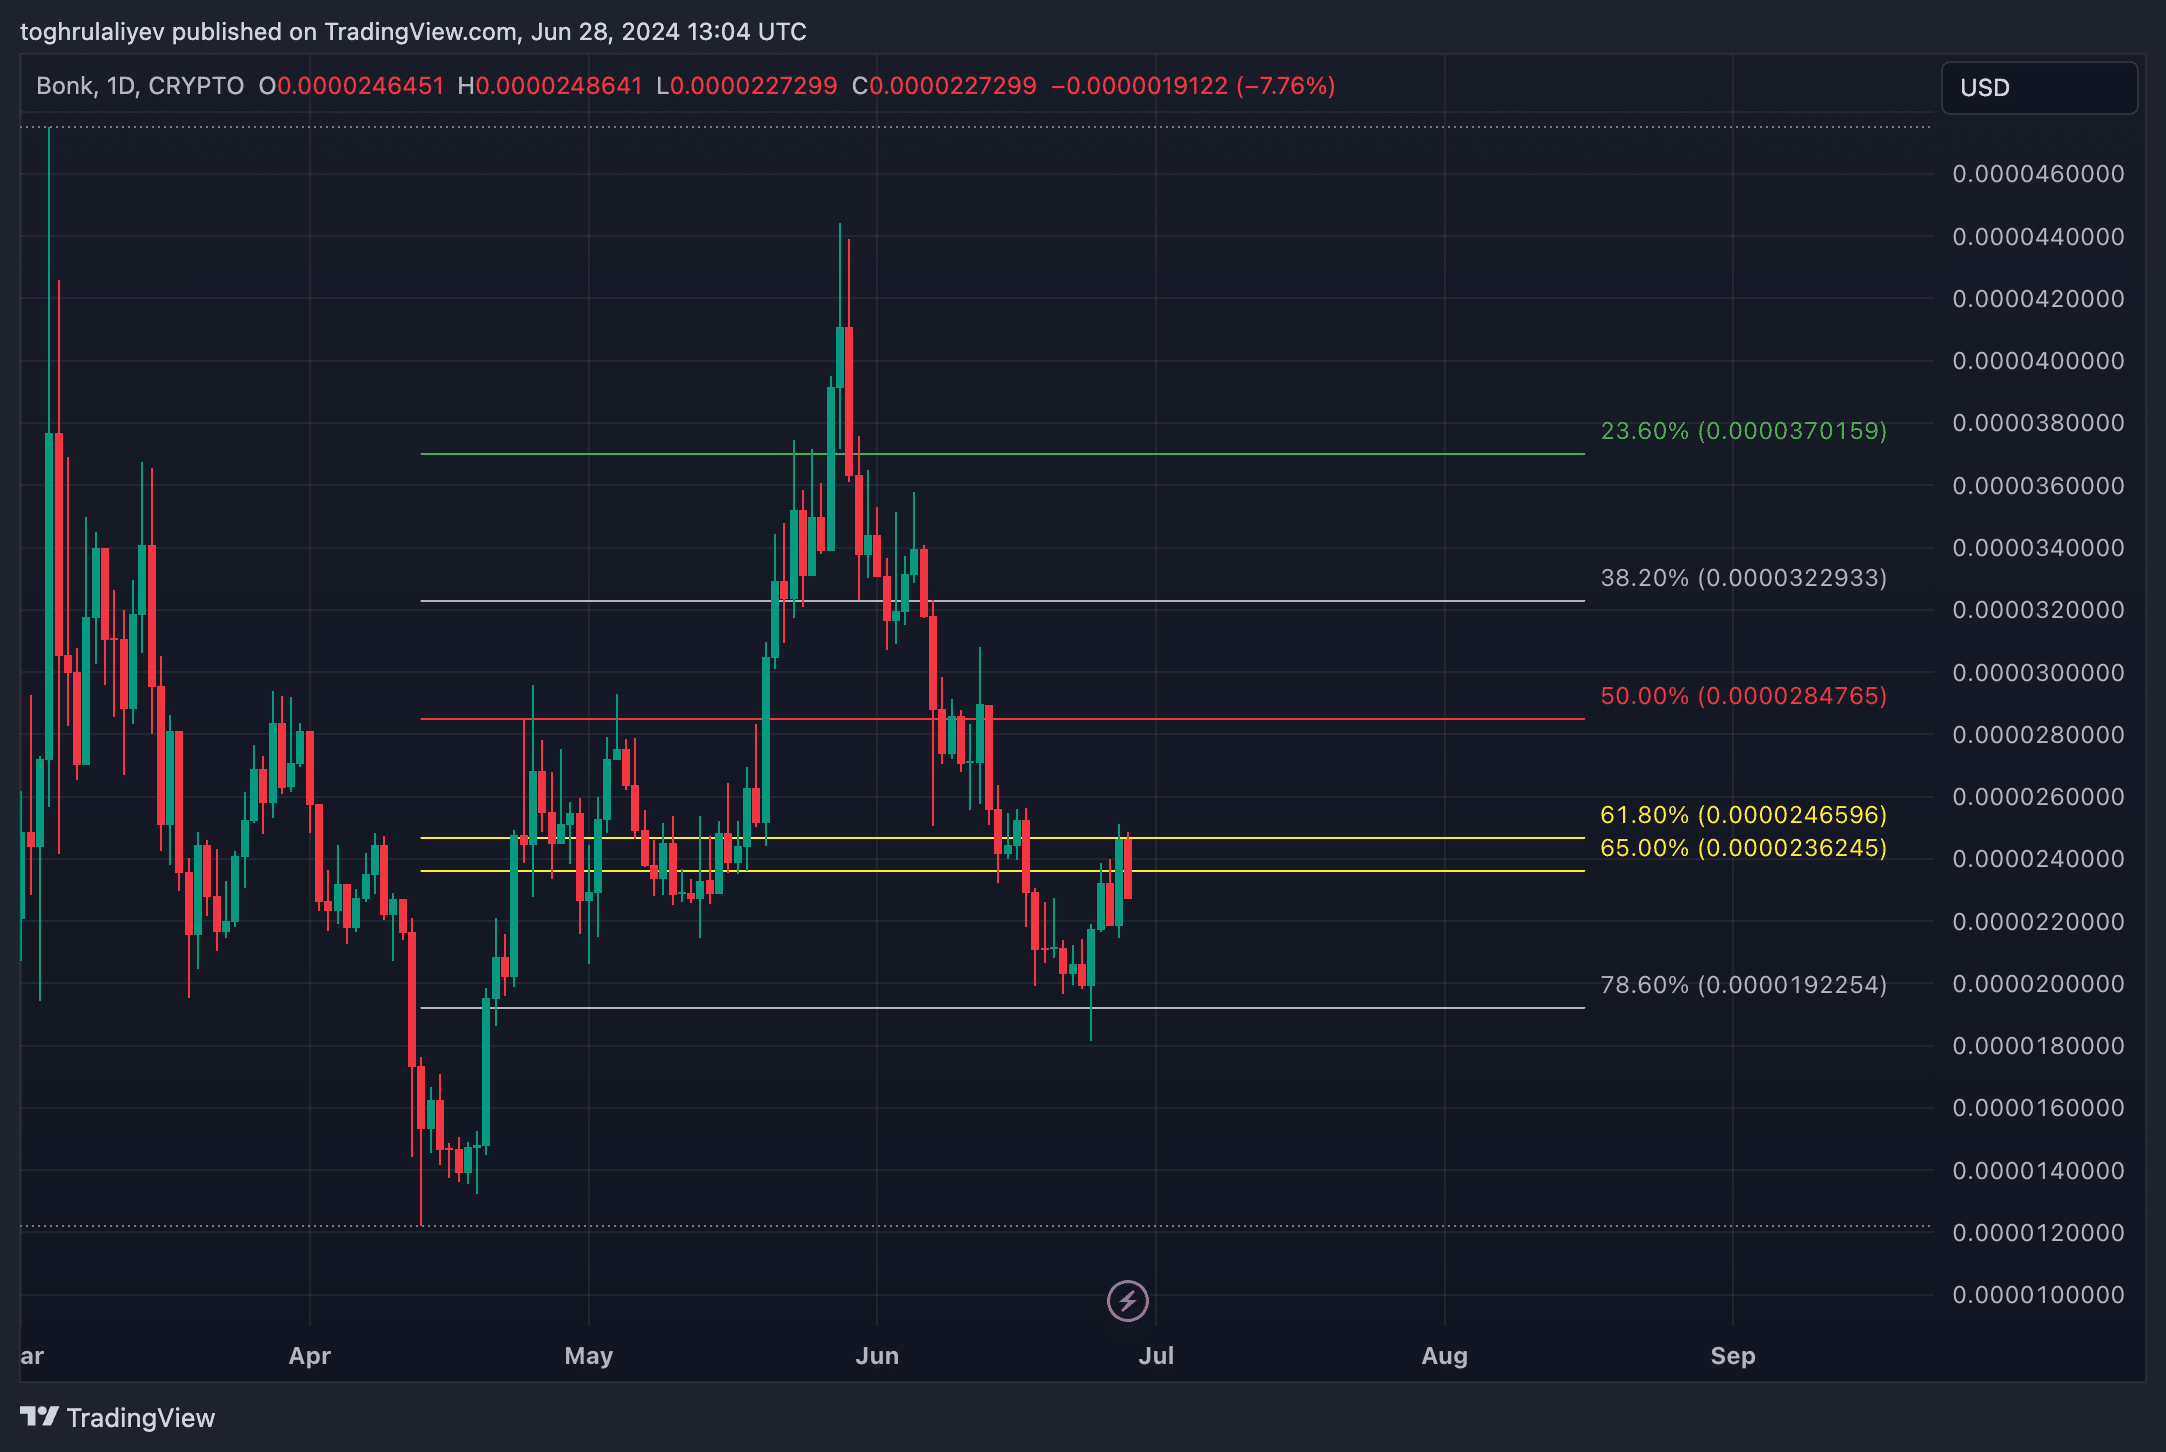
The chart shows a Deep Crab harmonic pattern, typically signaling a bullish price movement. The price has reached the first profit target at the 23.6% Fibonacci retracement level of $0.000024343 but has not yet closed above it.

Fibonacci Analysis
The Fibonacci retracement from the low on April 13 to the high on May 28 identifies a golden pocket between $0.0000236245 and $0.0000246596. This aligns with the 23.6% retracement from both the June 24 low to the June 28 high and the May 28 high to the June 24 low. The confluence suggests a critical level for BONK to break through.
Strategy
Given the current analysis, a cautious approach is recommended:
- Entry Point: Wait for a confirmed breakout above $0.000025 before entering a long position.
- Alternative Entry: Consider entering between $0.00002 and $0.000021 if the price fails to break through $0.000025 and retraces back.
Profit Targets
If BONK breaks out and closes above the psychological price point of $0.000025, the profit targets are:
- First profit target: $0.000026
- Second profit target: $0.000028
- Third profit target: $0.00003
Each level must be confirmed to be close to the previous target to validate the next target.
Final Notes
It’s important to remain vigilant as meme coins like BONK are highly volatile and may not always adhere to logic or technical analysis. Adjust positions accordingly based on market movements.
Disclosure: This article does not represent investment advice. The content and materials featured on this page are for educational purposes only.